The Data Dress
A tactile data visualization project honoring American women from all walks of life
The data dress summarizes 160 years of census date into three colorful hand-stitched charts. It took 50+ hours to embroider. The dress tracks fertility rate, marital status, and the growth of ethnic groups of 25-year-old women (my age) in the USA from 1850 – 2010. I chose to embroider a dress by hand as a way of honoring the women who came before me, many of them seamstresses, factory girls, housewives, and enslaved women who sewed every day. In an age of quick digital design, I believe there is still power in taking the time to create physical things, by hand.
While this was primarily a data visualization project, I also wanted to create a dress someone would actually want to wear. The finished dress is something I look forward to wearing around Boston!


Reading the Dress
The following keys explain the dress patterns, so you can discover the story in the stitches!
Behind the Scenes: Making the Data Dress
inspiration
For Studio II, my professor Pedro Cruz asked us to develop a final project around the topic of diversity. Later that week, I went to brunch with an old friend and former freshman roommate, who told me that she and her husband were expecting their first baby. We hugged, cried, and looked on her pregnancy app to discover that the baby was the size of a mango that week.
As I rode the train home, I thought back to the freshman roommates and realized that, of the six of us, I was the only one who is (1) unmarried, and (2) childless. We are all 25 years old. Truthfully, sometimes it’s hard for me to see my friends married to wonderful, supportive life partners while I try to psych myself up for –yet another!– blind Tinder date. My home state of Utah has the lowest average age for first marriage in the USA, with women marrying around 24 and men marrying around 26. To add to the pressure, I grew up in a culture that places an enormous focus on the pursuit of healthy marriages and families. I firmly believe in those ideals, but also struggle to find purpose as my life looks different than the cultural “ideal”.
It suddenly struck me that THIS is a form of diversity. Diversity of Life Stage.
But how much of an outlier am I really? I was comparing myself to an incredibly small group: five women who went to the same school as me, in the same state, mostly my ethnicity, with similar cultural backgrounds.
What if I expanded my comparison group to all 25 year old women in the USA? What if I dug into census data and expanded the group to all 25 year old women in the USA from 1860 onwards… over 160 years of 25 year old women?
The Data
To begin my research, I used IPUMS to create a custom data set sampling females, aged 25, from the decades 1850 – 2010. The resulting extract had over 600,000 rows of data. I explored variables such as Education Level, Literacy, Marital Status, Languages Spoken, Race, Number of Children, Age at First Marriage, and Employment Status. Since this dress was going to be hand stitched, I needed to narrow the scope of my exploration. I settled on Race, Marital Status, and Number of Children.
Tableau Desktop handled the large data extract surprisingly well, and I started to play around with some exploratory visualizations. Suddenly, the data had a shape! (See if you can spot the Baby Boom in 1960… you’ll notice a huge increase in married women, and a spike in the average number of children per 25-year-old woman.)


information design
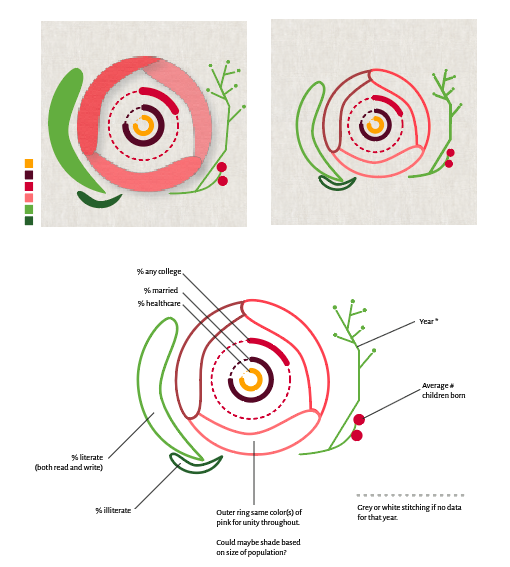
Once I had a general idea of data trends, I needed to figure out how to represent them in a way that was accurate, beautiful, and stitchable over the course of a month. My original ideas were inspired by florals. Each flower cluster would represent a decade, and variables would be represented by rings of donut charts, number of petals, size of buds, etc. This approach would be symmetrical, intricate, and feminine.
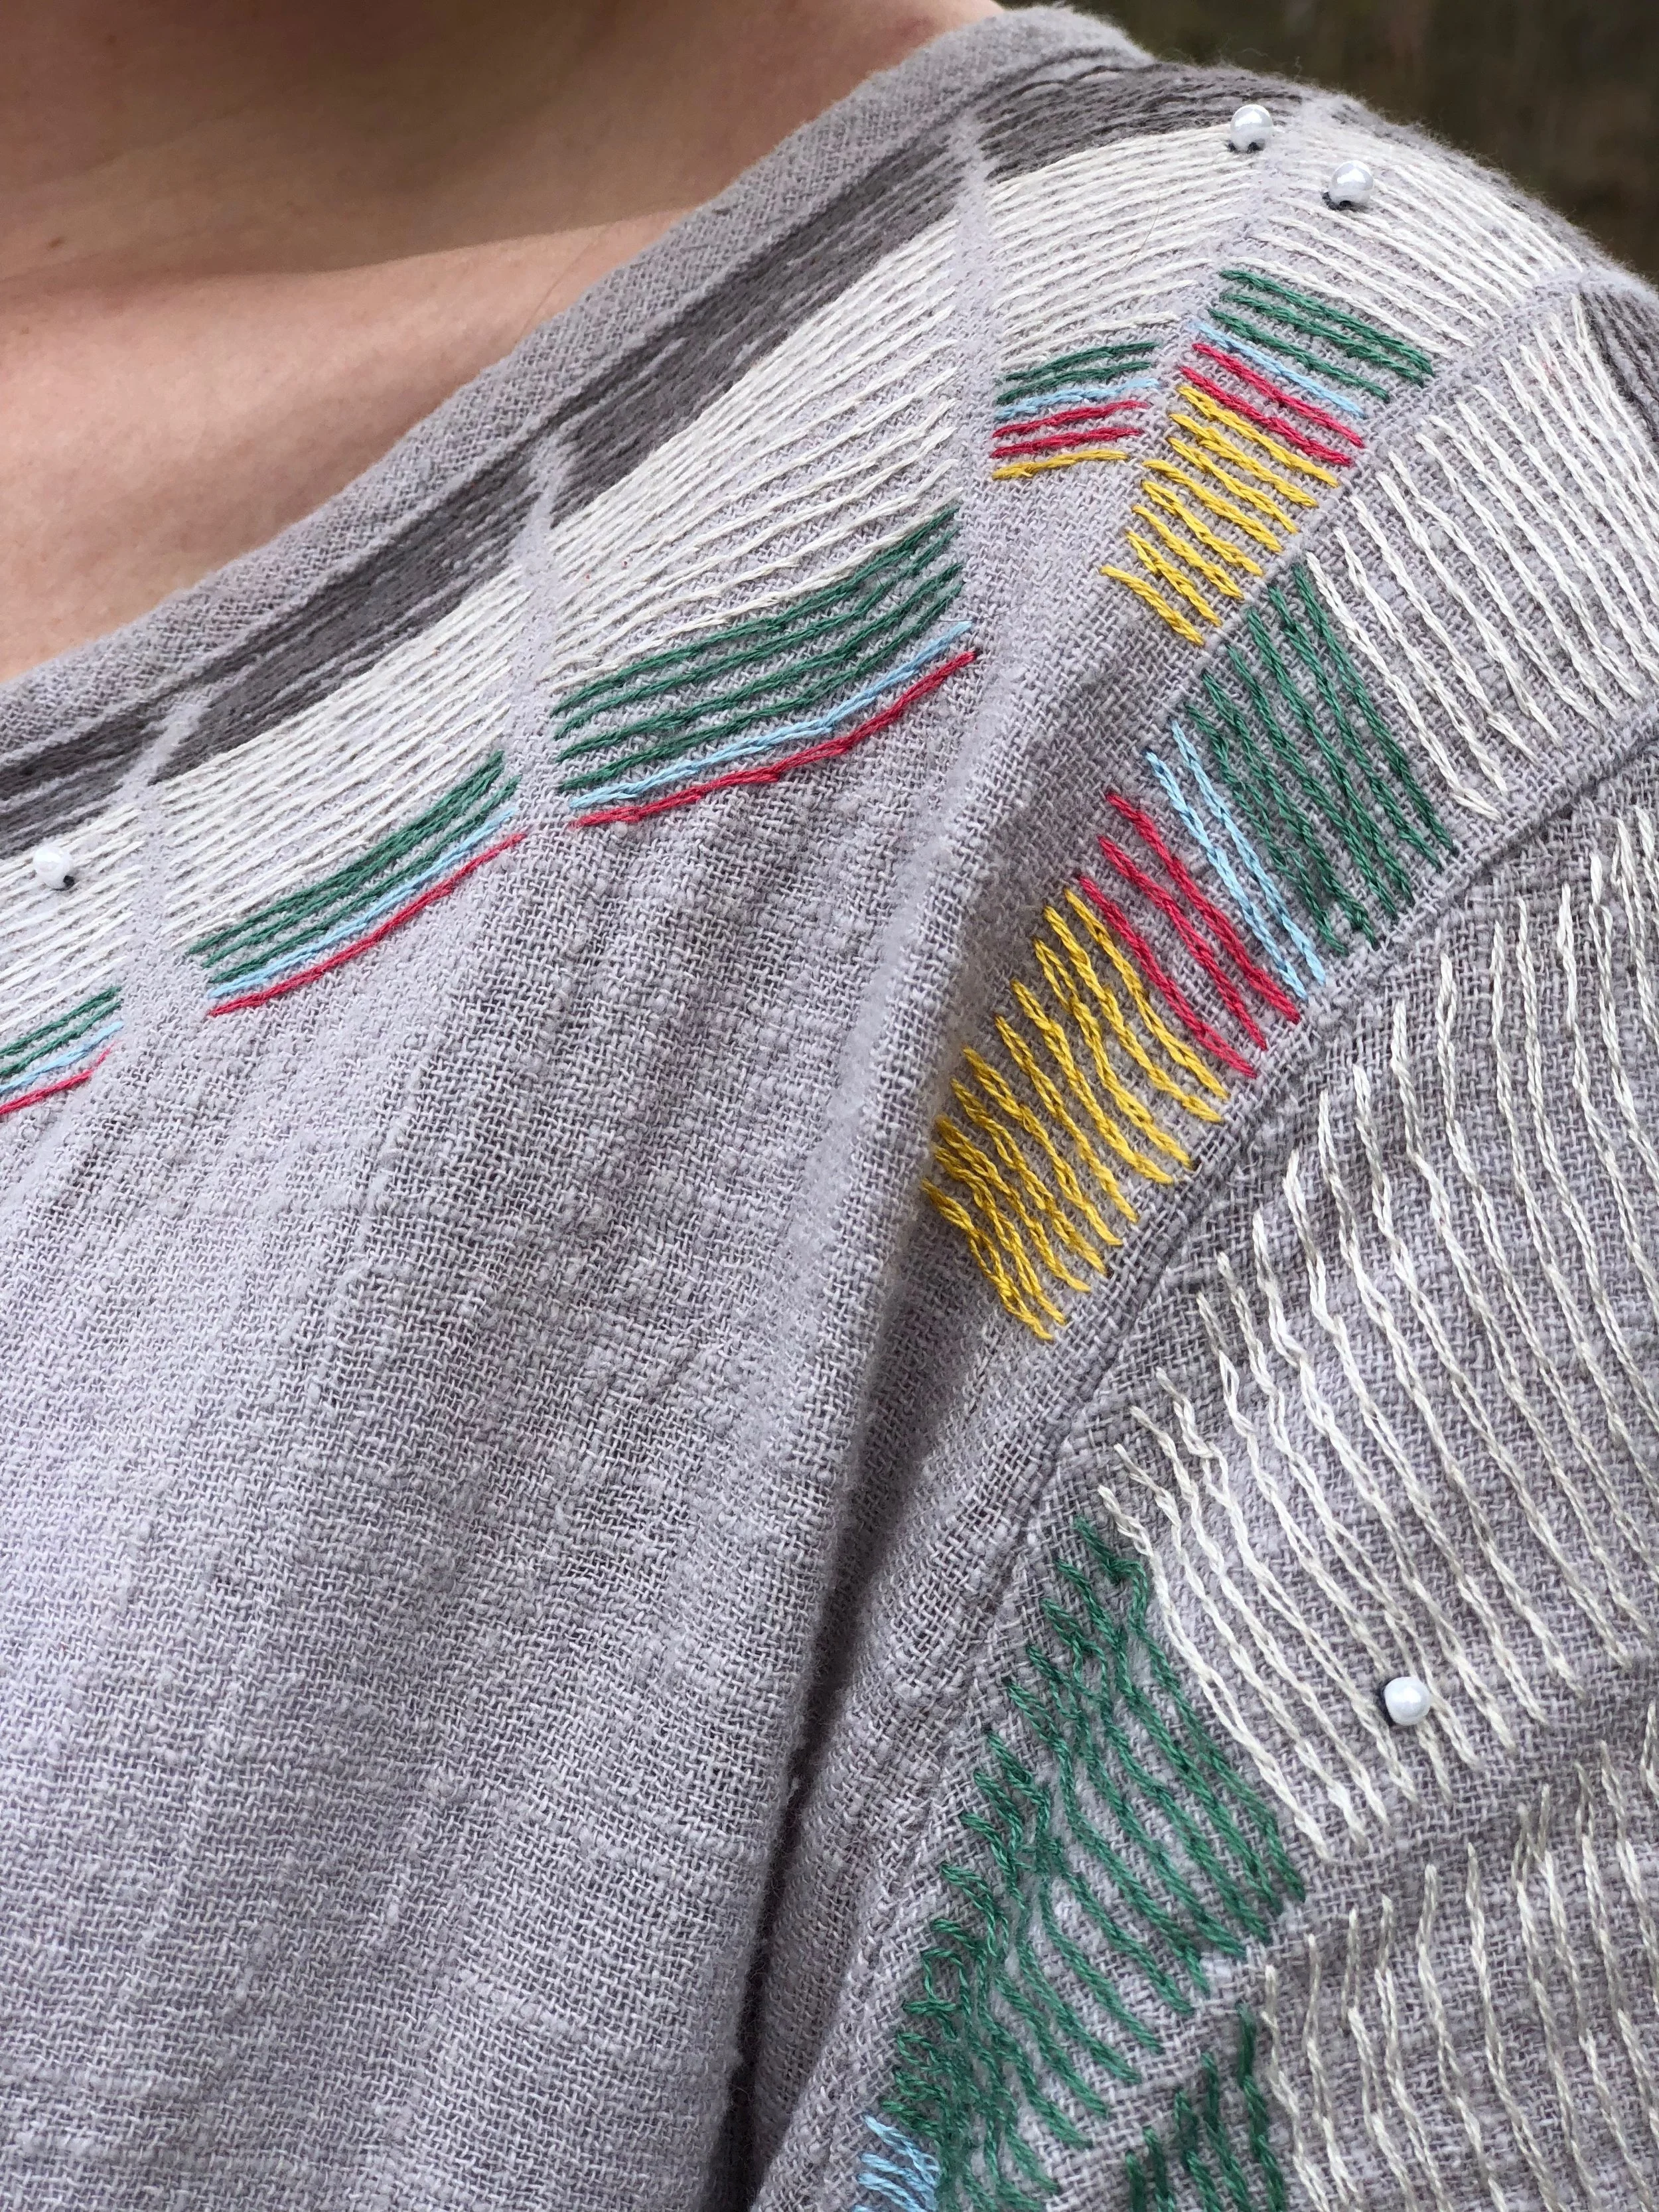
A few iterations later, I decided on a more abstract pattern that would allow readers to ‘feel’ the flow of the data rather than having to bounce back and forth between unconnected flower clusters to compare numbers. The bodice/sleeve would show the population growth of racial groups, the spine would show marital status trends, and the hem would represent fertility.

embroidering
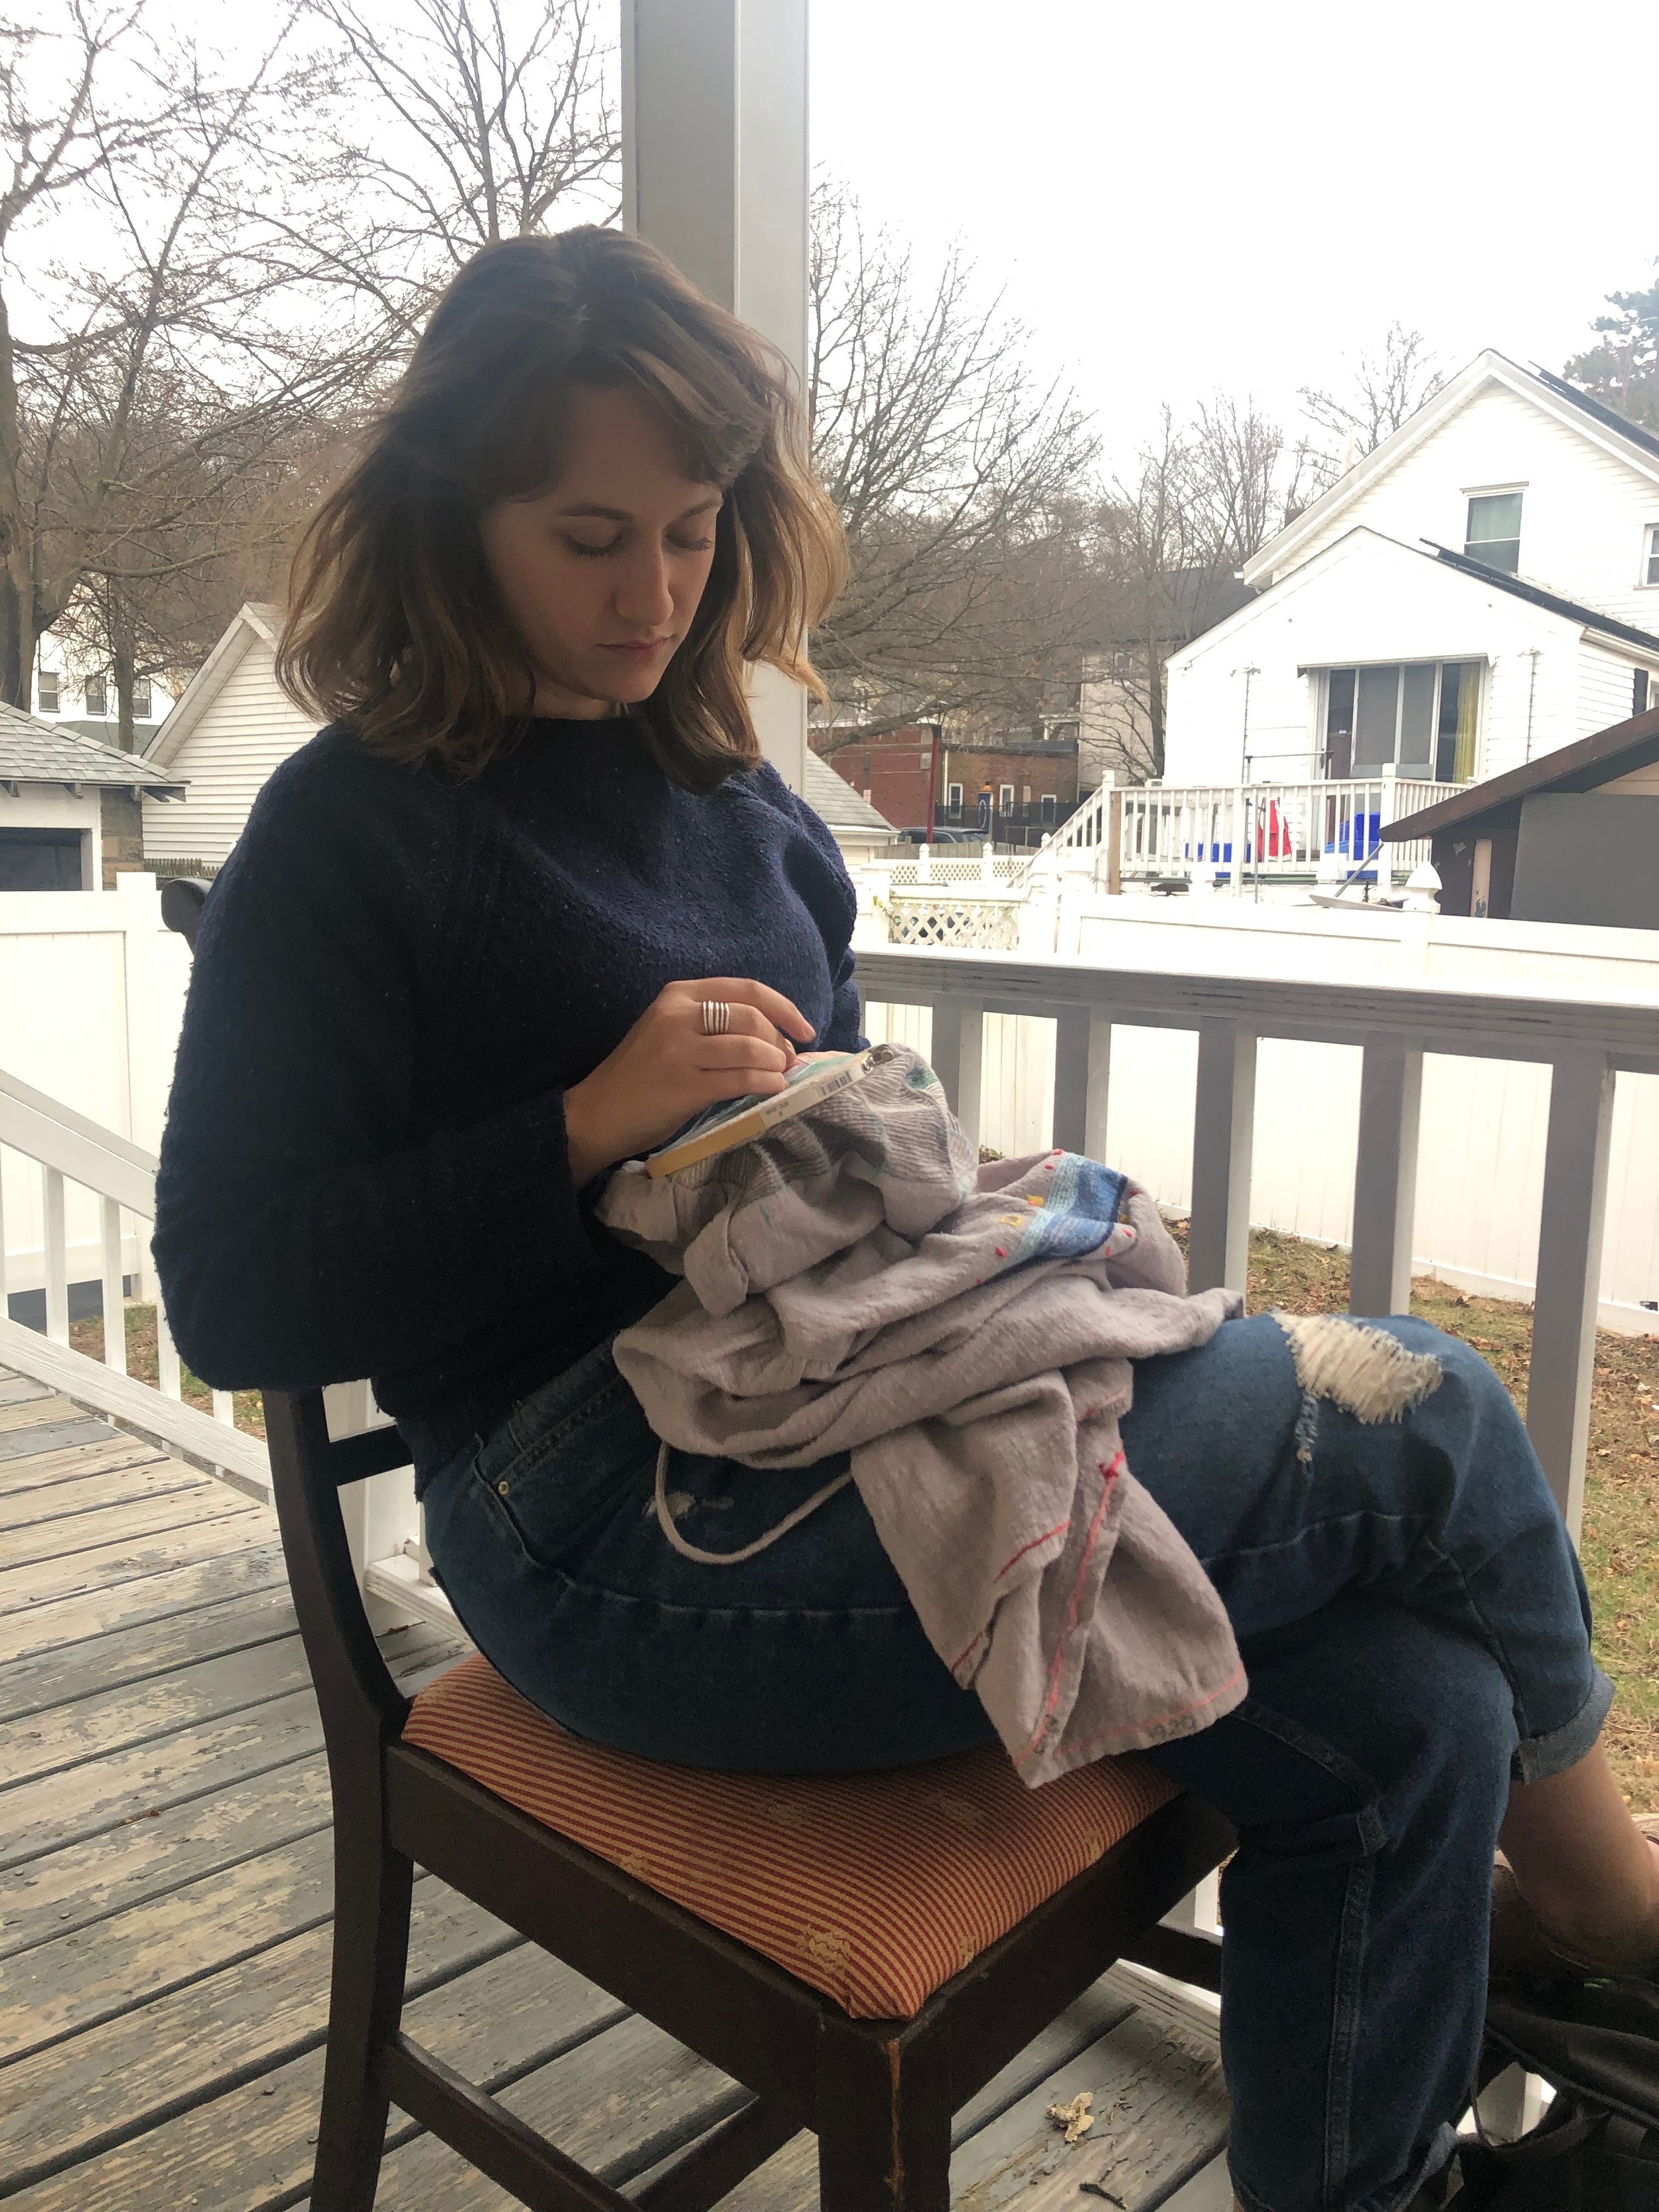
I bought this linen dress on Amazon, stopped by Stitch Boutique to pick a palette of silk embroidery floss, transferred my designs with a water-soluble marking pen, and then got sewing…. and sewing… and sewing. I stitched in class, with dogs, and on back porches. I stitched on the train, at dinner, and on dates. Finally, after over 50 hours of embroidery, the dress was finished.


LEARNINGS
Data mining is wayyyy more fun if you’re genuinely fascinated by the topic. In my project, every data entry represented a real woman, my age, who lived/worked/loved/cried/tried just like me.
Recognize that everyone has their own style of design…. hone and be proud of yours. Sometimes I felt inferior looking at my classmates sleek websites and infographics. But then I remembered learning embroidery from my mom, and realized that I spent my entire life mastering techniques to do a great job on my specific project.
Let the data change your design ideas. The final dress design looks vastly different than what I planned originally, but it does a better job of guiding the reader through the data.
Adjust your timeline as you learn how long things take. A few hours into embroidery, I realized that my estimate of “oh, 15 hours or so” to finish sewing was way off. Rather than panicking, I measured how long it took to do certain areas of the dress, and used that to map out a more realistic timeline for completing the project.
Look for opportunities to blend data and objects in the physical world.
The Data Dress project was featured in the Northeastern CAMD News on April 25, 2019.