Visualizing Group Therapy
Designing a tool to visualize conversations and improve therapist skills
Can data visualization help group therapists provide better therapy? In recent years, data collection has become integral to the personal and professional lives of millions around the world. But despite the increase in available technology and data, the process of training and supervising group psychotherapists has hardly changed in fifty years.
Medical charts and visualizations have historically focused on quantitative data. My thesis explores an intriguing new possibility for data visualization in mental health care: using transcript data to visualize conversations in group therapy sessions, and ultimately use these insights to help therapists and supervisors provide better care.
Illustration: Libby Thomas, 2020
Why visualize group therapy?
Group therapy is popular for many reasons. Unlike individual therapy, groups allow counselors to work with multiple clients in a short period of time. Group therapy is used for many situations, from substance abuse recovery to mindfulness meditation. At an emotional level, groups provide members with a sense of community that is impossible to develop in individual therapy. By sharing and listening, group members feel a sense of “universality”, the knowledge that they are not alone in their experiences.
Irvin Yalom, a pioneer of group therapy, noticed that groups also function as a "social microcosm". In group therapy, clients exhibit the same interpersonal behaviors that they do in their outside interactions, allowing therapists and other group members to comment on unhealthy interactions and practice new, healthier behaviors.
However, group therapy can be unhelpful or even dangerous in the hands of unskilled or poorly trained psychologists. How, then, can we train better group therapists?
This thesis introduces prototypes for a visualization tool to help therapists and their supervisors explore patterns, conversation topics, and dynamics in group therapy. The tool will use data from automated session transcripts and allow users to search conversations, view outcome trends for individuals and groups, and visualize group dynamics over time.
Design Process
Gathering information through a literature review and interviews with four group therapists, I learned that the most important variables to visualize in a group session were talk times, speaker segmentation, directionality of comment, and content of the utterance.
I am a tactile person, so my first designs were physical prototypes exploring ways to visualize talk times. I wanted to find ways to visualize who spoke, how long they talked for, and when they tended to participate in the session.
A design inspired by Morse code. Black rectangles represent utterances from the therapist over the course of a session. Length of the mark corresponds to how long the therapist spoke. White or cut spaces (see below) indicate client speech.
Two prototypes showing session time, changes in vocal arousal, speaker segmentation, interruptions, and silence
Next I hand-coded data from a sixty-minute group therapy demonstration (via psychotherapy.net) to gather realistic session data. The data included speakers, length of comment, vocal arousal, and recipient of comment. With this data, I began to prototype digitally using Tableau and Illustrator.
A note on the data: The supervisors I interviewed also indicated that they would be interested in a visualized “report card” of therapist skills. These skills include empathy, appropriate self-disclosure, and specific therapeutic interventions. In the interest of time, my first push for prototypes focused exclusively on visualizing session dynamics. However, when I coded the full session demonstration, I coded various therapist skills as well, for use in future prototypes.
Chart Literacy and Session Visualization
An interesting challenge of this project is that very little design work has been dedicated to visualizing group conversations. Most college-educated individuals are comfortable reading scatterplots, bar charts, and line graphs. But to effectively convey information about session dynamics, a designer may have to push readers to navigate less familiar chart types.
I had originally planned to approach therapists with a mockups of a session visualization dashboard in a realistic-looking product. However, the “chart literacy” hurdle lead me to consider a different approach. Now, my first step in evaluation will be testing different types of visualization to see what professional therapists find readable and useful. Only then will I know what kinds of chart will be most effective, and should be included in the product.
(Above) Possibilities for visualizing speaker activity during a session.
(Below) Comparing the effectiveness of several chart styles to represent group member talk times for both single and combined sessions.
Final Designs for Therapist Evaluation
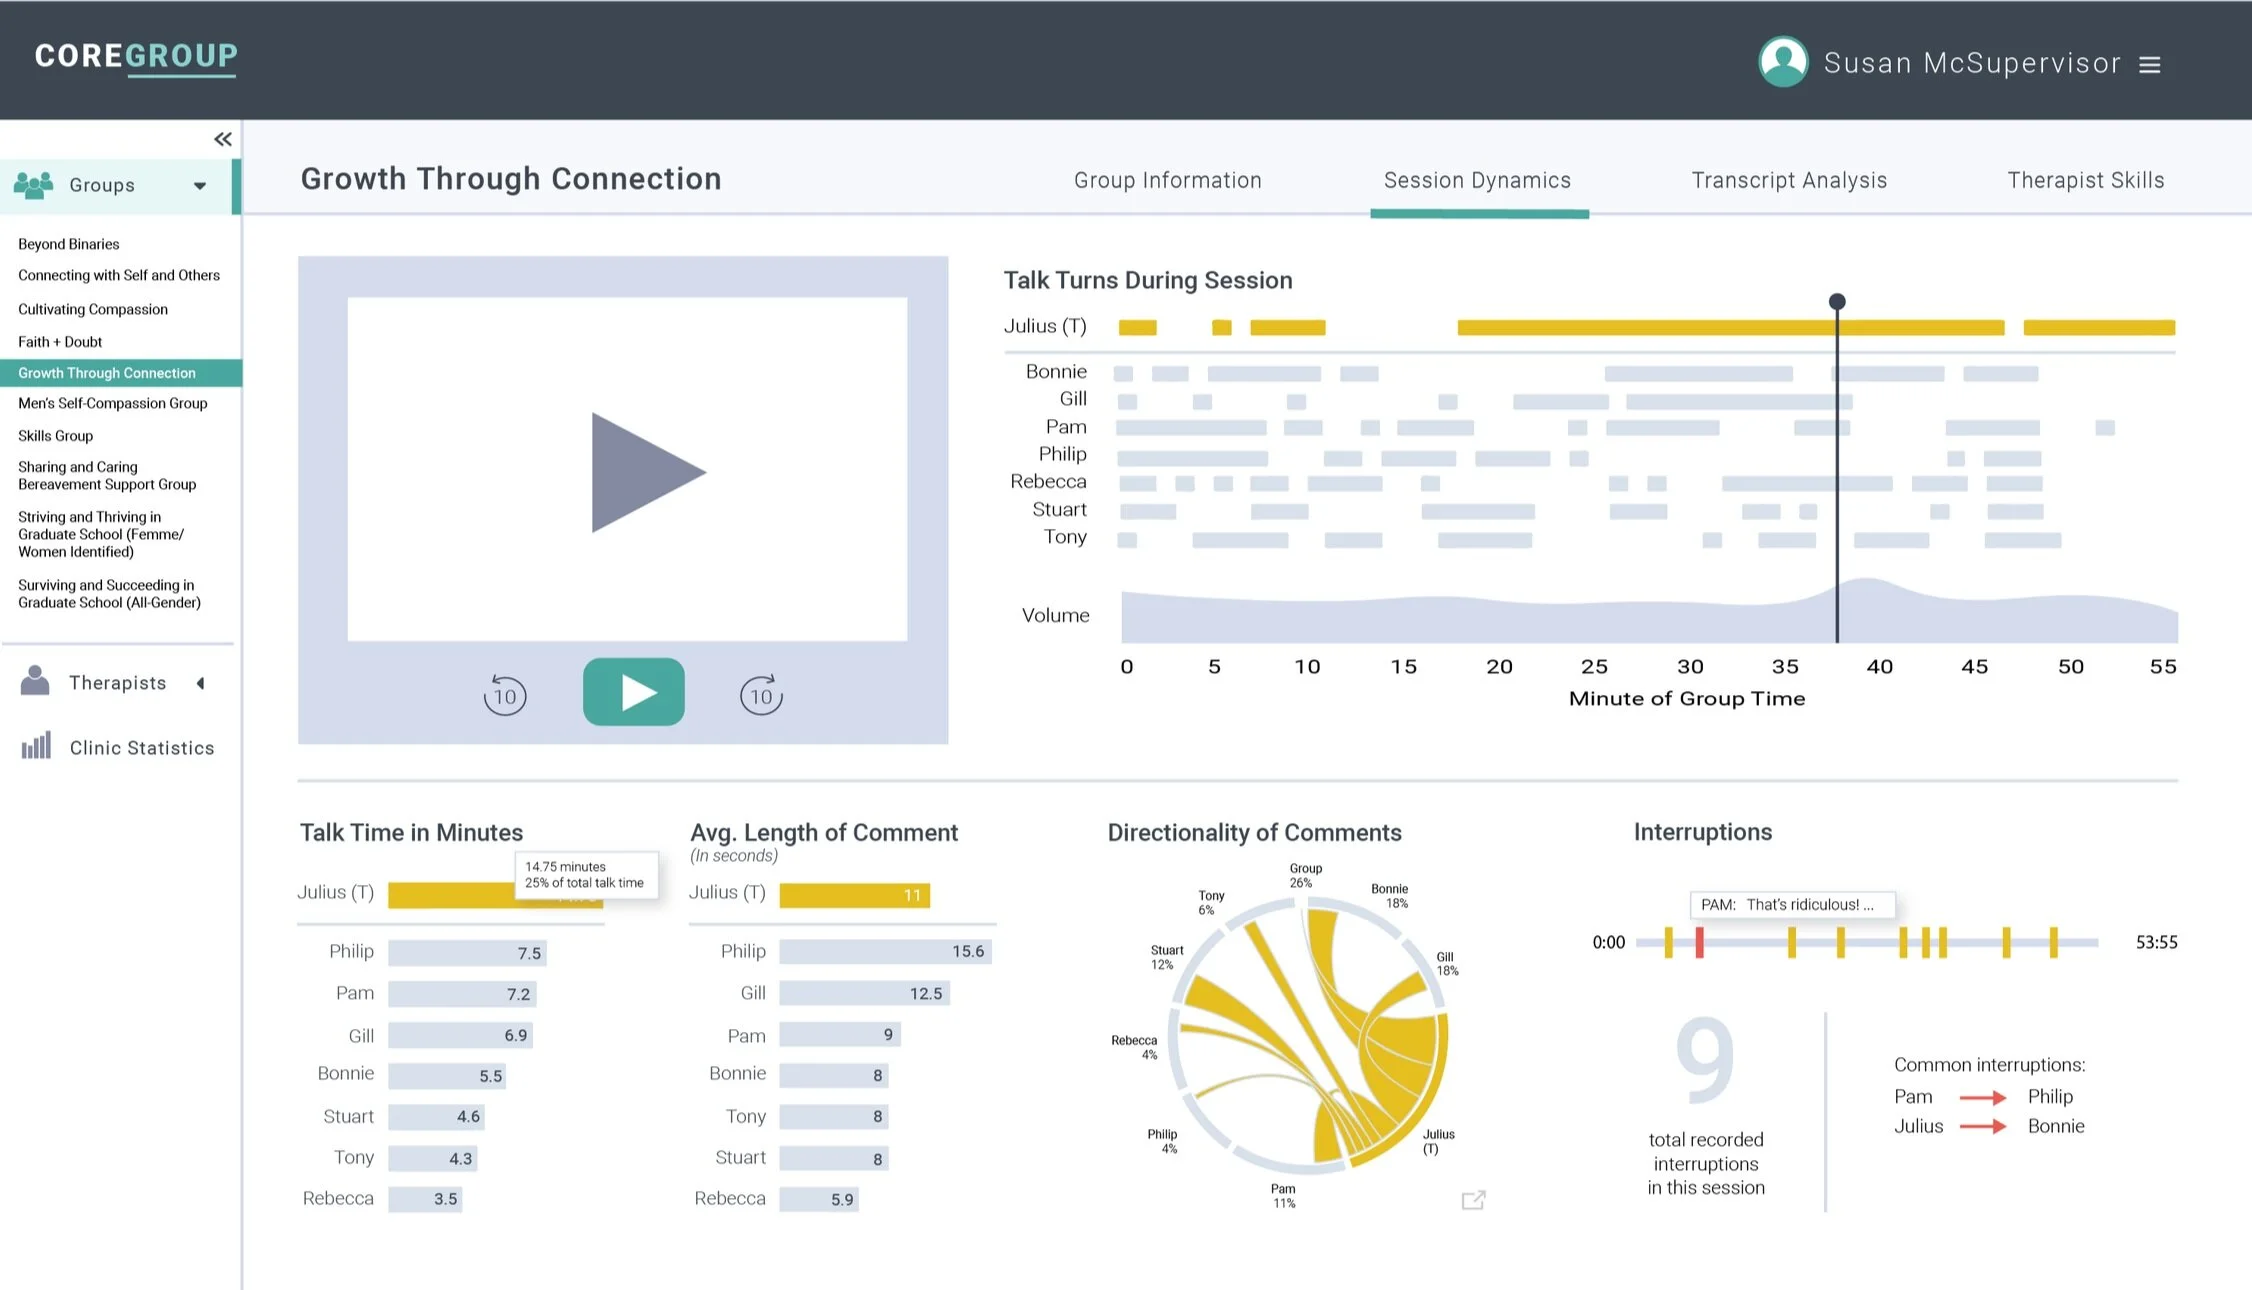
The final design splits the transcript data into three dashboards: Session Dynamics, Transcript Analysis, and Therapist Skills, all housed in an online provider portal.
SESSION DYNAMICS: The Session Dynamics portal focuses on WHO speaks, WHEN they speak, and HOW they speak.
(Above) Zoomed in talk-time chart that shows seconds instead of minutes.
(Right) Chord chart indicating the percent of time Julius (the therapist) spent speaking to the group and each member in it, as well as the proportion of their speaking time they spent talking to Julius.
TRANSCRIPT ANALYSIS: This portal features a searchable script linked to the original video or audio file, as well as a chart highlighting key topics of discussion and level of group member participation during each of those conversations.
THERAPIST SKILLS: This report shows a graphic of every therapist talk turn, and specific behaviors the therapist demonstrated in each utterance. Select skills below to see them highlighted in the session and, watch/listen to them from the original recording. Skill usage is indicated below using bullet charts (invented by data designer Stephen Few) and viewers can compare this session’s usage to past-self, all therapists in the clinic, or established national standards where applicable.
Beneath the session media portal is a collaborative journaling space for therapists, co-facilitators, and supervisors to make comments on the session and identify areas for discussion.
Evaluation and Next Steps
So… do group therapy providers find these graphics clear, interesting, and useful? I am currently scheduling and conducting remote focus groups via Zoom. The participants have a range of career experience and comfort-level with data visualization. To gather a variety of view points, therapists were recruited from both a well-funded university counseling center and urban community clinics. Though I am still in the early stages of gathering, analyzing, and implementing feedback, the initial response has been encouraging.
Early thoughts:
"I think I would be super excited but also nervous because I might have to face some truths about myself... which is a really good thing!"
”I can see this helping me pick up on things that I might not have picked up on in the moment."
"There are some patterns that I've seen over the years, but I would love to see my own patterns. What I avoid, what I move towards, what I resist... all that would be really helpful."
"This would be great... it's like a personal consultant that I can look at when I have time to get some external, objective viewpoint of what I'm doing, which I can't attend to when I'm trying to run a group."
“It's also very pleasing to look at. The layout... for very complex information it feels accessible and friendly, which I really appreciate."
Learnings from this Thesis:
Pick projects that are meaningful to you. Knowing that you are doing something useful will sustain you when you’re burnt out.
Explain your work to many different people. You will explain things differently to your professor, your grandma, and a friend with another research focus. You can learn things from discussing your work from various angles, and you will get fresh input from new sources.
Surround yourself with kind people who are great at what they do. (Shoutout to Tad, Torrey, Rebecca, Jake, Arushi, Yuan, Molly, and so many others.)
Recognize what it feels like when you need to reset. Take a nap, go on a walk, pet a dog, make a real meal, don’t be afraid to call it a day if you’re not accomplishing anything. Don’t get stuck in limbo where you’re not working, and you’re also not recharging.
Know when to call it a night. Energy levels are different for everyone, but here’s my rule: When you hit a wall late at night – even if you have a deadline tomorrow– shut off your computer and go to sleep. Wake up super early if you need to.
The library is your friend. It’s so many things you need: online databases, subject guides and librarians, physical books on actual shelves, and a safe, quiet place to work at any hour of the day.
Vulnerability is not unprofessional. If you are feeling overwhelmed, tell someone. Use this as an opportunity to problem solve together and set expectations that will work moving forward. Figure out what you really need and ask for it.
Know that you will get better at this. Tackling a thesis or any big project is daunting, but in a few months you will look back and be shocked at how much better you’ve become at research, academic writing, design, time management, communicating with team members, and more. You can do it!
(To a student wrapping up a graduate thesis about group therapy in the midst of a global pandemic, this comic could not have landed better.)